


Exponential Innovations Everywhere
* * *
Joost Bonsen's Opinions on How Money, Ideas, and Talent can
Enable Health, Wealth, and Happyness for Each plus Achieve Liberty, Prosperity, and Vitality for All and Ultimately Help Us Spread Beyond Our Cradle Planet Earth


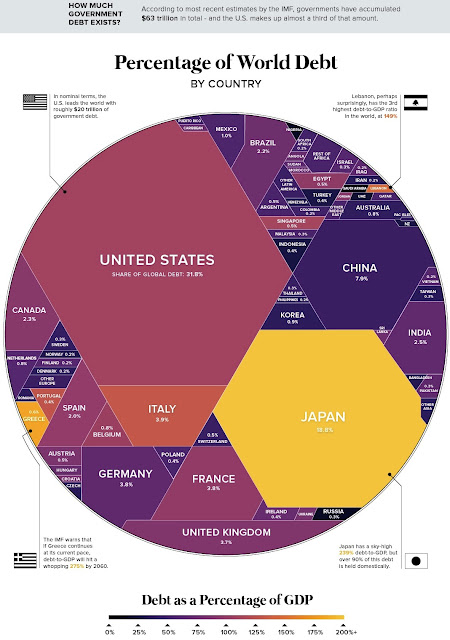
"Around the globe countries have taken to the idea of running constant deficits as the normal course of business, and too much accumulation of debt is not healthy for countries or the global economy as a whole."

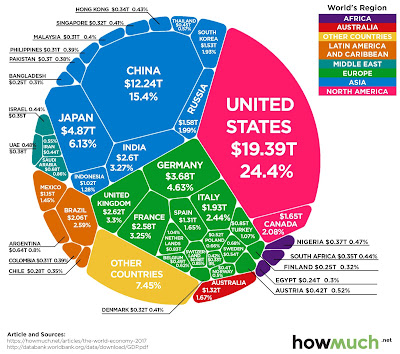
"The full circle, known as a Voronoi Diagram, represents the entirety of the $74 trillion global economy in nominal terms. Meanwhile, each country’s segment is sized accordingly to their percentage of global GDP output. Continents are also grouped together and sorted by color."
 P.S. The actual graphing was done by HowMuch.net


