

Dive Into the Ghent Altarpiece
4 hours ago
Exponential Innovations Everywhere
* * *
Joost Bonsen's Opinions on How Money, Ideas, and Talent can
Enable Health, Wealth, and Happyness for Each plus Achieve Liberty, Prosperity, and Vitality for All and Ultimately Help Us Spread Beyond Our Cradle Planet Earth
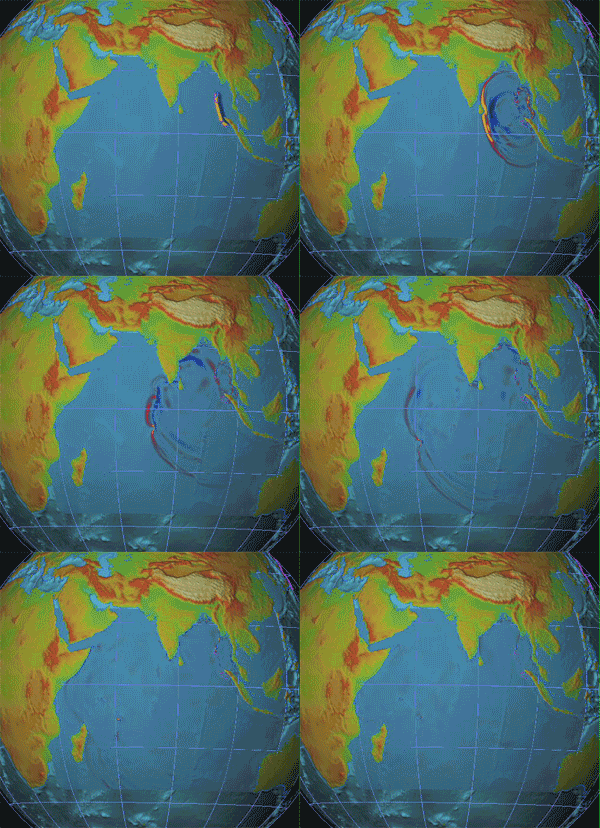 Second, look at this seismographic plot from around the world showing the Earth literally ringing from the rupture of the Sunda megathrust off the coast of Sumatra, Indonesia...
"The image charts 11,967 tropical cyclones that have occurred on Earth since the NOAA began keeping a record in 1842, when data was supplied by ships and lighthouses rather than today’s advanced satellite detection systems."First zoom in on USA...
 Global visual of storm intensity...
"Light from the changing angles of the sun highlight the structure of the clouds. [...] The "super rapid scan" images -- one every minute from 7:15 a.m. until 6:30 p.m. EDT -- reveal details of the storm's motion. Animation by Kevin Ward with images from NOAA and University of Wisconsin-Madison Cooperative Institute for Meteorological Satellite Studies."And here gCaptain posts Sandy Wave Height buoy data...


"The biggest threat scenario involves the hurricane colliding with a cold front from the West, creating a "superstorm" that could stall over the Eastern seaboard for days. Residents [should] prepare for the possibility of a week or more without power."NOAA forecasts possible paths...


 gCaptain spots 3D Titanic on Google Earth mashing up National Geographic, NOAA and other data! RIP -- this great ship sank a century ago tonight-early tomorrow...
  And, finally, the latest simulation of what happened...
"Citizen monitoring and reporting can help NOAA scientists better understand the location and nature of the debris generated by the earthquake and tsunami in Japan. Ships traveling the Pacific Ocean and beachcombers on the coast can now report significant sightings. If reporting a sighting, be sure to include what you saw, when you saw it, and where it was located."They've got tracker apps and emailables plus they've tried to model what will happen via OSCURS...

"The 2011 Atlantic hurricane season officially ends on Nov 30 and produced a total of 19 tropical storms of which seven became hurricanes, including three major hurricanes. This level of activity matched NOAA's predictions and continues the trend of active hurricane seasons that began in 1995. [...] This animations merges both the visible and infrared imagery taken by the GOES East (GOES-13) satellite every 30 minutes over the Northern Hemisphere from June 1 -- November 28, 2011."
"The 2010 Hurricane Season tied with 1887 and 1995 having the third highest storm count on record with 19 named storms. But short-term weather patterns dictate where storms actually travel and in many cases this season, that was away from the United States. The jet stream's position contributed to warm and dry conditions in the eastern U.S. and acted as a barrier that kept many storms over open water. Also, because many storms formed in the extreme eastern Atlantic, they re-curved back out to sea without threatening land. This movie shows GOES-13 infrared imagery from June 1 through November 30, the official extents of the Atlantic Hurricane Season."


